

Consensus, Control, Change: Ranking the Modern Chiefs Upon John G. Roberts’ 20th Supreme Court Term
Marking Chief Justice John Roberts’s 20th Term, this article uses Supreme Court Database metrics to compare the five modern Chief Justices on consensus, leadership in close cases, and doctrinal impact

Who actually runs the Supreme Court? Felix Frankfurter insisted the answer was “no one.” “Aside from the power to assign the writing of opinions…a Chief Justice has no authority that any other member of the Court hasn’t…The Chief Justice is primus inter pares. He presides…in Court and at conference.” That’s the civics-book truth: nine life-tenured judges, each a sovereign vote, no formal boss. William Rehnquist, who wore the striped sleeves and still kept score like a realist, said much the same: the chief’s vote “carries no more weight,” and any hope that a skillful administrator will “bring the Court together” is mostly fantasy. He presides over eight “associates…as independent as hogs on ice. He may at most persuade or cajole them.”
Yet persuasion and cajoling matter—especially in a world where the person in the middle can decide who writes the opinion everyone else must sign. That is where the office becomes something more than a ceremonial gavel. As my friend Dan Cotter puts it in his book The Chief Justices, a successful Chief “has the ability to be a superior among his equals,” using the job’s quiet levers to shape the Court’s image and legacy. The levers aren’t hidden: preside at conference, frame the questions, assign the majority when in the majority, and—at critical moments—pick up the pen.
John Roberts has telegraphed how he sees that responsibility. He defends hard criticism of decisions but urges restraint when it turns ad hominem against colleagues. Roberts flexed the power of the Court to imprint his vision of the relative power of the main federal institutions in major decisions that raised passionate responses from both end of the Court. He was able to assemble majority coalitions and write the majority opinions in several opinions relating to the separation of powers that have already had huge ramifications. In national-security disputes he warns that constitutional rules “that would inhibit the flexibility of the President…should be adopted only with the greatest caution,” signaling deference at the edges of judicial competence (Trump v. Hawaii). And in statutory fights, he sometimes chooses institutional stability over maximalism, as when he saved the Affordable Care Act in King v. Burwell: “In a democracy, the power to make the law rests with those chosen by the people…A fair reading of legislation demands a fair understanding of the legislative plan.” Those are not just lines; they are choices about tone, coalition, and the scope of holdings. They are also choices a Chief is uniquely positioned to orchestrate.
So how do we separate mythology from management? This article takes Frankfurter’s and Rehnquist’s caution seriously and tests Cotter’s claim with data. Using the Supreme Court Database, I track three things you can actually observe across the five modern Chief-Justice eras—Vinson, Warren, Burger, Rehnquist, Roberts: whether the Court speaks with one voice (consensus), how the Chief manages close cases (leadership), and how often doctrine truly moves (impact). Because not every case is Marbury, I weight the docket toward the matters that plausibly mattered most—close votes, reversals, and formal alterations of precedent—while normalizing by term and issue area so different eras remain comparable. The result practical scoreboard of how Chiefs used the tools Frankfurter and Rehnquist described—and whether, in Roberts’s idiom, those tools produced decisions that could command five to nine votes without fraying the Court itself.
What follows is the picture that emerges from that approach: a composite index of the five Chiefs; the specific behaviors that drive it (majority placement, 5–4 assignment strategy, and one-vote authorship); and a map of where each era’s most important work clustered by issue area. If the Chief is only first among equals, this is where that “first” shows up—or doesn’t.
Once you accept Frankfurter’s and Rehnquist’s premise—that the Chief’s formal power is thin and his real influence is managerial—the next step is to look for the places that management leaves fingerprints. That is what the figures do. They line up the five modern Chief-Justice eras—Vinson, Warren, Burger, Rehnquist, and Roberts—and ask three concrete questions: did the Court speak with one voice when it mattered, how did the Chief manage the closest cases, and how often did the Court’s law actually move. Every comparison is built from the same Supreme Court Database fields and every rate is adjusted so eras with different dockets can be compared without games.
A single scoreboard to orient the story
I constructed the composite from the SCDB alone, weighting cases by observable signals of importance and then aggregating to era-level rates.
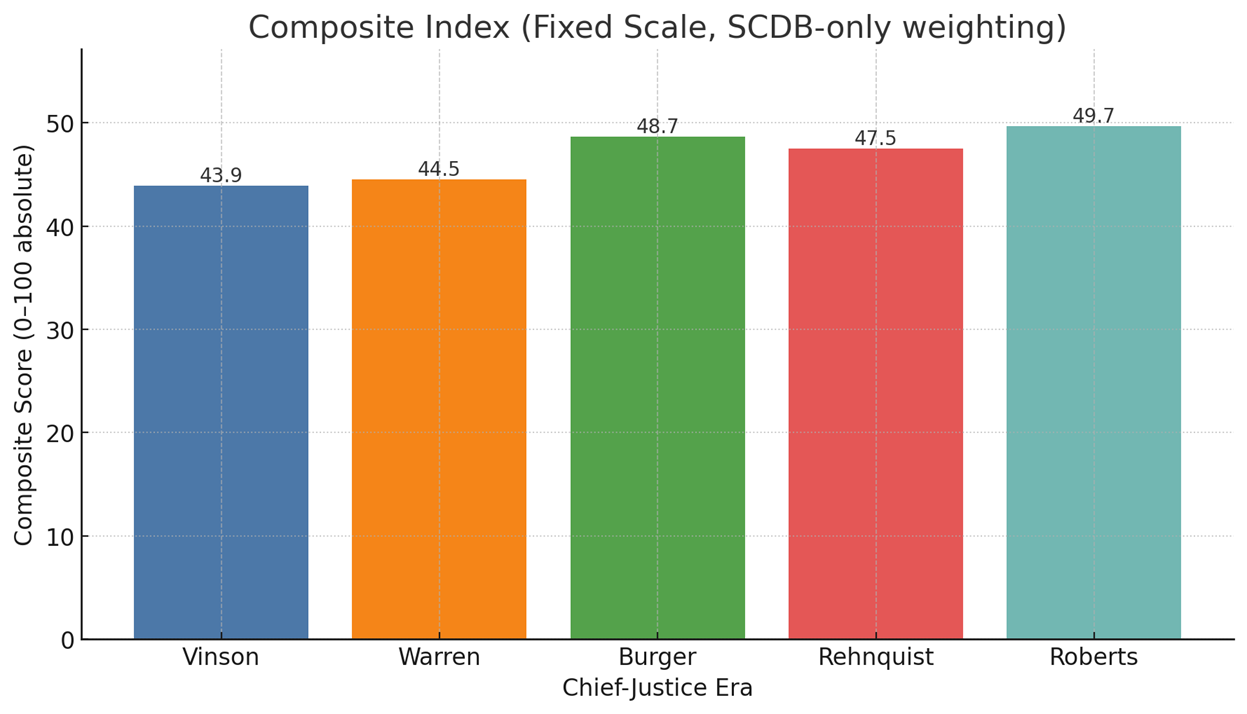
The bars report each modern Chief-Justice era’s composite score on an absolute 0–100 scale (no cohort normalization), using the same color for each Chief as in your other figures. The labels above the bars are the exact composite values. On this fixed scale, Roberts sits at the top of the group, followed closely by Burger and Rehnquist, with Warren and Vinson a bit lower.
Scale construction:
Case weights (importance): For each case we start at 1 and add points for closeness (5–4, 6–3, 7–2), formal precedent alteration, reversal of the lower court, and recorded disagreement below. I then normalize within term × issue area (z-score, clipped) and convert to a positive weight w=1+0.5zw = 1 + 0.5zw=1+0.5z. This tilts the averages toward high-stakes cases while keeping eras comparable across topics and time.
Sub-indices on a 0–100 absolute scale:
Consensus = 100 × ½( weighted unanimity + (1 − weighted 5–4 rate) ).
Leadership = 100 × the mean of four weighted rates: Chief in the majority (divided cases), assignment rate overall, assignment rate in 5–4s, and Chief authorship in one-vote cases.
Impact = 100 × ½( weighted precedent alteration + weighted reversal rate ).

Because everything is on a fixed absolute scale, no era is forced to be “best” or “worst.” Roberts’s lead reflects a blend of high weighted unanimity with targeted control of close cases—not simply the mix of eras in the comparison.
Start with the composite. Think of it as a dashboard collapsed to one dial. It blends three families of behavior—Consensus, Leadership, and Impact—so you can see, at a glance, which eras combined those traits most consistently. The scale runs from 0 to 100 within this five-era cohort; a 10-point gap is a real distance in style and results, not a rounding error.
What does the dial summarize? The next figure opens it up.

This chart decomposes the composite into its three components—Consensus, Leadership, and Impact—after standardizing each component within the modern cohort (z-units; 0 equals the five-era average, ±1 is about one standard deviation). Bars are stacked above and below zero so you can see which components drive each era’s relative profile. A bar that sits mostly above zero means that era performed better than the modern average on those ingredients; below zero means below average. Read the shape to see how each Chief’s strength is built: a tall blue segment (Consensus) signals broad agreement on the most important cases; orange (Leadership) reflects the Chief’s placement in winning coalitions and assignment/pen control in tight cases; green (Impact) tracks observable doctrinal movement via precedent alterations and reversals. Use this figure to compare profiles across eras; for the absolute, non-relative performance see the fixed-scale composite chart in 0–100 points.
How to read the consensus measures (and why they’re adjusted)
“Consensus” here is the share of unanimous decisions set against its mirror image, the share of 5–4 decisions (the Court splits on the knife-edge). Both are weighted so the big fights count more than routine housekeeping. The weight goes up if the case was close, if the Court reversed the lower court, if the Court formally altered precedent, and if there was recorded disagreement below; then it is normalized within each term and issue area. That last step matters: it prevents older or topic-heavy eras from looking “more important” just because they saw more cases of a certain kind.
The Chief has to be with the five before he can lead

This chart answers the first tactical question: when the Court is not unanimous, is the Chief on the winning side? The vertical axis is a rate from 0 to 1; the denominator is all non-unanimous merits cases in the era; the numerator is the subset where the Chief’s vote is in the majority. High values indicate that the Chief either draws coalitions to his position or is adept at moving toward the emerging five. Roberts sits high on this measure. Rehnquist sits lower, and that isn’t a knock on skill so much as a reflection of docket temperature: his era simply had more sharp splits.
Two cautions keep this measure honest. First, it is not an ideology score; it is about placement in the winning coalition. Second, a lower rate can coexist with strong control elsewhere if the Chief compensates in assignment strategy—which brings us to the next lever.
Assignment is leverage, especially at 5–4

By custom, the Chief assigns the opinion when in the majority. The first panel shows how often, in 5–4 cases, the assignment came from the Chief (again, the denominator is the era’s 5–4s where the Chief was in the majority). The second panel tightens the lens to who takes the pen: the Chief’s authorship rate in one-vote cases. These are managerial, not ceremonial, choices. Place the opinion with the right author and you keep your fifth vote; take the pen yourself and you can narrow the rule, calibrate tone, and craft the footnotes that keep a coalition intact.
You can see two patterns. Rehnquist and Roberts both show assertive assignment in 5–4s, and both personally author a meaningful share of those one-vote decisions. That is what control looks like when consensus is scarce: you don’t win every divided case, but you shape the ones you win.
Where the fights and the coalitions were: the issue-area maps
The Court’s docket isn’t homogeneous. A Chief’s ability to secure unanimity or manage close cases varies by subject, and the subject mix changes across eras. The heatmaps let you see both facts at once.

Every cell here is a weighted unanimity rate for a Chief × issue area combination; darker shades mean more unanimity when the cases in that cell are the important ones. Rows are the 14 SCDB issue areas (Criminal Procedure, Civil Rights, First Amendment, … Private Action). Columns are the five Chiefs. Because weights are normalized within term × area, you can compare across Chiefs within a row without worrying that one era just had “more of that topic.” The pattern that pops: higher unanimity in Judicial Power, Federal Taxation, and Interstate Relations (structural/technical disputes), and lower unanimity where the Warren and Rehnquist Courts did their most ambitious work—Criminal Procedure, Civil Rights, and parts of Federalism.
This is the mirror: the weighted share of one-vote outcomes, again by Chief × area. Under Rehnquist, civil-rights and federalism cases are often at the razor’s edge; under Roberts, pockets of Administrative and Economic Activity disputes stay contentious even as the broader docket grows more unanimous. The two maps together show that “consensus Chief” and “polarized docket” can coexist if the polarization is concentrated rather than generalized.

Finally, this map shows where each era’s salient docket clustered. For each Chief, take the top 10% of cases by the importance weight and ask what share fall in each issue area. Each column sums to 1. This is not a judgment about what should matter; it’s a descriptive picture of what did matter. Warren’s top-decile is heavy with Criminal Procedure and Civil Rights; Burger’s with Criminal Procedure and First Amendment; Rehnquist’s with Economic Activity and Federalism/Judicial Power; Roberts’s with Judicial Power, Administrative Law, and Business Regulation. That shift in agenda explains a lot of the differences you see in the earlier charts.
Why this sequence fits the job the Chief actually has
Put together, the figures track exactly the levers Frankfurter and Rehnquist described. Consensus shows whether the Chief converted nine sovereign votes into clear law when stakes were high. Leadership shows whether he placed and wrote the opinions that decide the hardest cases. Impact shows whether the era changed the law rather than simply applying it. The issue-area maps keep us honest about where those effects happened and why they varied. And because everything is adjusted within term and subject, the comparisons do what readers want them to do: they show style and effect, not just docket trivia or era bias.
A Lasting Picture
The Guardian recently quoted former judge (and Roberts friend) J. Michael Luttig: “John Roberts knows exactly what he is doing…and he knows exactly the message he is sending to America.” The piece describes a Chief with disciplined self-awareness who cares deeply about the Court’s public image. His attention to detail is legendary; he rehearses questions and even fine-tunes jokes before argument. “He speaks so smoothly—and disguises his inner convictions so thoroughly—that he has been able to straddle political and personal divides,” one advocate said. That public craft matches the managerial traces the data leave behind: a Chief who values consensus, chooses his moments to take the pen, and keeps the institution’s voice steady even when the docket’s edges are sharp.
That managerial profile is exactly what the composite index is designed to detect. Roberts tops that roll-up not because he is the most transformative—Warren’s era still registers the largest formal doctrinal shifts—but because he combines the highest weighted unanimity with targeted control of close cases. He is frequently in the majority when the Court divides, he assigns strategically in 5–4s, and he takes the pen when it preserves the coalition. In practical terms, his Court tends to win by adding votes rather than raising the temperature, and it saves sharper moves for moments when they will stick. The index measures governance style and execution, not ideology—and on that dimension, Roberts comes out first among equals.
But what about the bigger picture? Taken together, the quotes and the numbers tell the same story. Frankfurter and Rehnquist were right about the limits: the Chief is one vote, not a boss. But Cotter’s “superior among equals” is visible in the traces a Chief leaves behind—how often the Court speaks with one voice, who gets the pen when the case is close, and whether doctrine actually moves. Those are managerial choices, and they vary across eras in ways the figures make plain: Warren as architect of change, Rehnquist as manager of knife-edge cases, Roberts as coalition-builder with a steady hand on assignments. None of this resolves the normative fights about outcomes. It does give us a fair, repeatable way to judge how each Chief used the office—how persuasion, not command, became decisions that lower courts must follow. If “first among equals” means anything at the Supreme Court, this is where it lives.
To subscribe, share, and comment
That said, this installment IS thrilling. Beyond that, I am still gagging.
All ready to read the next thrilling installment … but that picture stopped me cold. Roberts reverently gazing at a portrait of Rehnquist? To quote dear Moon Unit, “Gag me with a spoon!”