



Size and Momentum
In August 2025, the federal multidistrict litigation over Depo-Provera had about 550 pending actions. One year later, that number had climbed to 6,294.
The increase—more than tenfold in twelve months—did not make Depo-Provera the country’s largest mass tort. Johnson & Johnson’s talc litigation still had nearly 69,000 pending actions in August 2026. Bard’s hernia-mesh litigation had more than 23,000, and the aqueous film-forming foam, or AFFF, litigation had more than 15,000.
But Depo-Provera illustrates why the usual ranking of mass torts by case count can miss an important part of the picture.
Mass-tort litigation is often described in snapshots: how many cases are pending, which MDL is largest, and how many claims have accumulated. Monthly data from the Judicial Panel on Multidistrict Litigation make it possible to look at the same proceedings differently—not just by size, but by how quickly their pending inventories are changing.
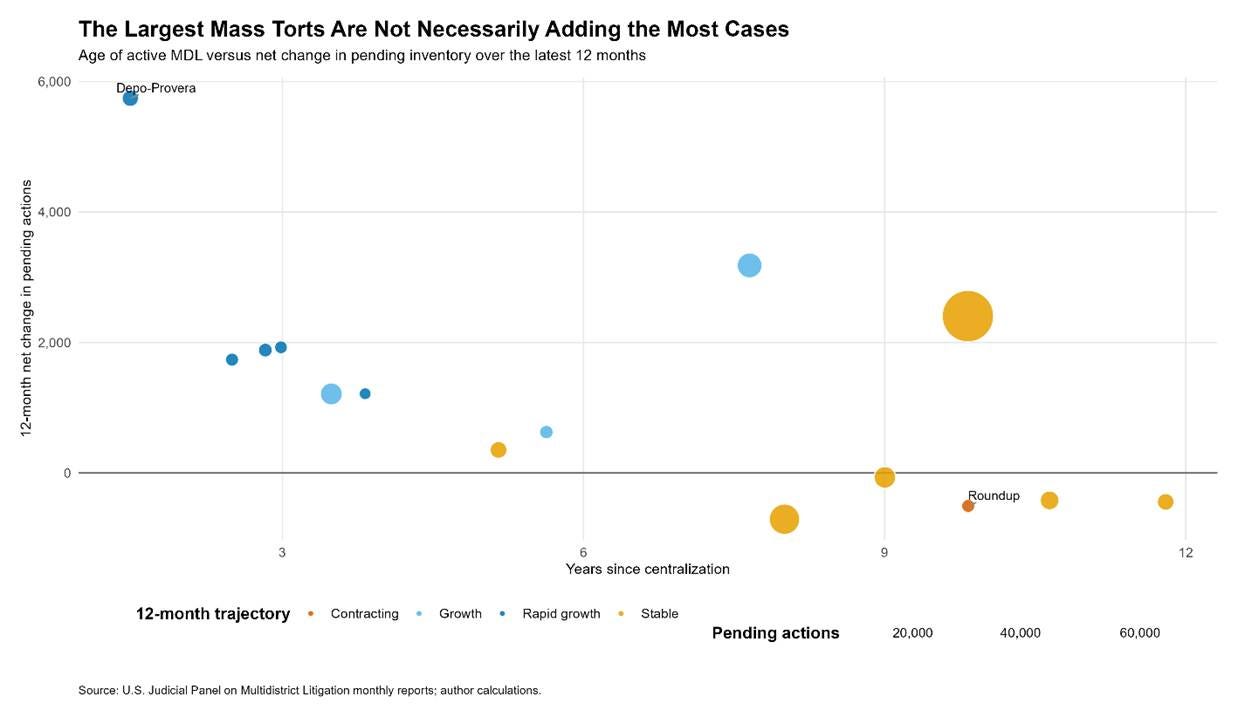
On that measure, Depo-Provera stands out. Its pending inventory increased by 5,744 actions between August 2025 and August 2026, or roughly 1,044%. More than 4,000 of those net additions occurred during the most recent six months.
Several other relatively young proceedings showed similar, if less extreme, growth. Bard’s port-catheter litigation increased from 1,807 pending actions to 3,734 over the same twelve-month period, an increase of about 107%. The GLP-1 litigation grew about 79%, Uber sexual-assault litigation about 75%, and the social-media adolescent-addiction litigation about 63%.
The largest MDLs followed a very different pattern. Talc, despite having more than ten times as many pending actions as Depo-Provera, grew by only about 3.6% over the year. Bard hernia mesh declined. The proton-pump-inhibitor litigation was essentially flat.
That distinction is meaningful to follow because current size and current momentum describe different features of a proceeding. A 20,000-case MDL with a declining inventory is not situated the same way as a 5,000-case proceeding whose inventory has doubled over the past year.
The broader federal docket is also highly concentrated. As of August 3, 2026, the JPML listed 162 active multidistrict litigations containing 205,540 pending actions. Just 21 proceedings with at least 1,000 pending actions accounted for more than 94% of that inventory. The five largest alone accounted for roughly 64%. Those figures show where the cases are concentrated. They do not necessarily show where the mass-tort docket is moving.
The contrast between Depo-Provera and the largest established MDLs suggests a different way to read the monthly numbers: not simply as a ranking of litigation size, but as a measure of litigation momentum.
When Growth Slows
AFFF shows why even momentum needs to be measured carefully. From August 2025 to August 2026, the AFFF MDL grew from 12,064 pending actions to 15,246, an increase of roughly 26%. Viewed only at those endpoints, it looks like one of the faster-growing large mass-tort proceedings.
The monthly path tells a different story. By November 2025, AFFF already had 15,249 pending actions. In February 2026 it had 15,216. By August, the count was 15,246. In other words, almost all of the year-over-year increase occurred during the first part of the period. Over the most recent six months, the net inventory increased by only about 30 cases.
That distinction is easy to miss in a conventional year-over-year comparison. A litigation can post substantial annual growth while having effectively stopped expanding in recent months.
AFFF is not an isolated example of why the interval matters. GLP-1 remains one of the faster-growing MDLs, with pending inventory up roughly 79% over twelve months, but its more recent growth is slower than the earlier portion of that period. Other proceedings, including Depo-Provera, Uber sexual assault, Bard Port Catheter and the social-media litigation, continued to add substantial net inventory during the latest six-month period.
The result is a second distinction beyond size and growth: momentum can itself accelerate or decelerate. That is especially relevant in mass-tort litigation because the headline number tends to lag the underlying direction of the proceeding. A large annual increase may reflect a surge that has already subsided. A smaller current inventory may be expanding much more rapidly than the largest cases on the docket.
The monthly JPML figures do not reveal gross filing volume. If 500 new actions enter an MDL while 400 are dismissed or otherwise leave the pending docket, the reported inventory rises by only 100. The figures therefore measure net inventory movement rather than new claims filed.
But for tracking trajectory, that limitation does not erase the signal. A proceeding whose pending inventory has been essentially flat for six months is behaving differently from one adding thousands of net cases over the same period, even if both posted strong year-over-year growth.
AFFF makes that point particularly clearly. Its twelve-month increase remains substantial, but its recent path looks much more like a plateau than continued rapid expansion.
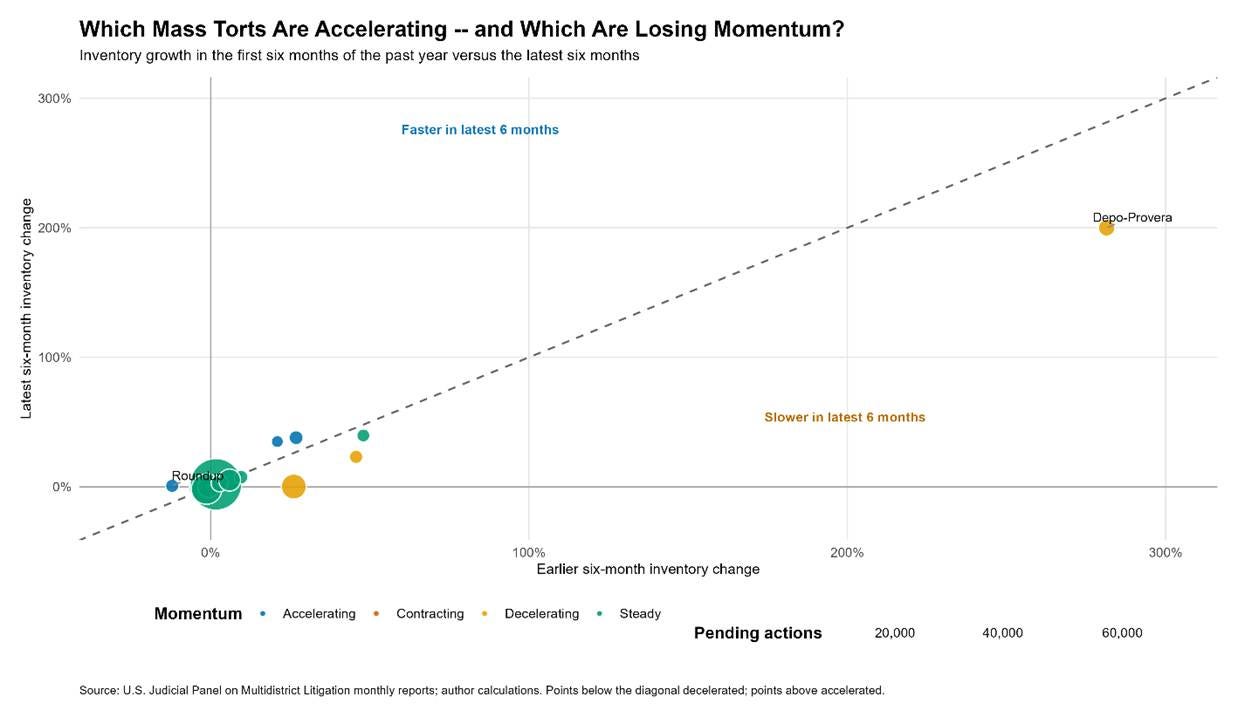
The practical implication is straightforward: a single growth rate is not enough. To understand where a mass tort is moving, it helps to know not only how much its inventory has changed, but when that change occurred.
What ‘Active’ Conceals
The opposite end of the spectrum is just as revealing. Zantac remains an active MDL, but its current posture looks nothing like Depo-Provera or GLP-1. As of August 2026, only 847 of more than 15,000 historical actions remained pending, or about 5.6%. The 3M Combat Arms litigation provides an even more dramatic example. In August 2024, it still had roughly 238,000 pending actions. Two years later, only two remained pending out of more than 391,000 historical actions. Together, those examples show why “active” is an administrative category rather than a useful description of where a litigation sits in its lifecycle.
The same current case count can carry very different information depending on how a proceeding arrived there. A newer MDL with nearly all of its historical actions still pending may still be accumulating claims and moving toward a larger inventory. An older proceeding with only a small fraction of its historical actions remaining may instead be in a prolonged period of contraction. Several of the larger, mature MDLs fall somewhere between those extremes. Cook IVC Filters, Bair Hugger, Bard hernia mesh, Roundup and the proton-pump-inhibitor litigation all sit below their highest observed inventories during the August 2024 to August 2026 period, and most also declined over the past year.
That creates a useful third dimension for comparing mass torts: not simply size or momentum, but how much of a proceeding’s accumulated federal inventory remains on the docket. The ratio is imperfect. A case leaving the pending count can reflect dismissal, settlement, remand or another procedural outcome, and the JPML data do not identify those outcomes individually. It would therefore be misleading to treat the percentage as a settlement rate or as a measure of substantive success. But it still adds context that the raw pending count lacks.
Consider two MDLs with roughly 4,000 pending actions. If one has about 4,000 historical actions and the other has 15,000, the proceedings are plainly not in the same position. The first may still be near its accumulated high-water mark, while the second has already seen most of its historical federal inventory leave the pending docket. That difference can shape how lawyers, funders, insurers, companies and investors interpret the same headline number. “Four thousand cases remain” conveys something quite different when that figure represents nearly all of a proceeding’s historical actions than when it represents only a small residual share.
A useful description of an MDL therefore needs to separate at least three things: how large it is now, whether its inventory is growing or shrinking, and how much of its historical inventory remains pending. Those measures can point in different directions, and the cases that stand out by one measure are not always the ones that stand out by another.
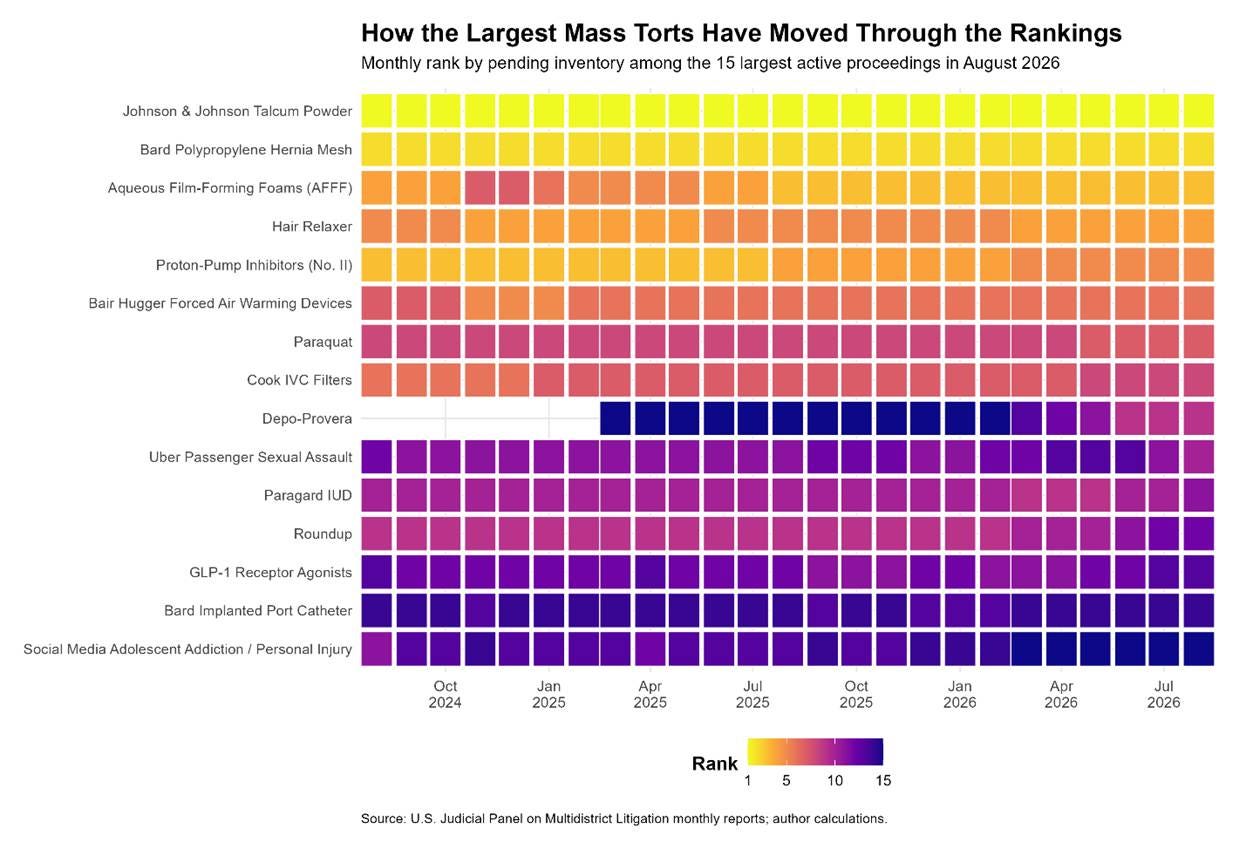
The movement in those rankings reinforces the same point. Some established mega-MDLs remain dominant, but newer proceedings can rise quickly as their inventories build while older ones gradually fall back as their pending counts decline. The federal mass-tort docket is therefore better understood as a changing mix of proceedings at different stages of development than as a fixed leaderboard.
Mass Torts as Trajectories
The examples also show why the timing of an observation can change the story. Depo-Provera looks modest next to talc if the comparison is only current size, but extraordinary if the comparison is twelve-month growth. AFFF appears strongly expansionary on a year-over-year basis but much closer to flat over the most recent six months. Zantac looks small today largely because most of its historical federal inventory has already left the pending docket. Taken together, those examples suggest that an MDL is more usefully described as a trajectory than as a single case count.
That does not require a complicated model. A small set of measures already captures distinctions that disappear in conventional rankings: current pending inventory, short- and medium-term net change, whether growth is accelerating or slowing, the age of the proceeding, and the share of historical actions that remain pending. No single measure establishes whether an MDL is mature, risky, or likely to resolve soon, but their combination can distinguish a young accumulation phase from a large but slowing proceeding or a mature docket that is steadily contracting.
Aggregate MDL statistics can also move sharply when one exceptionally large proceeding changes stage. The 3M Combat Arms litigation is the clearest recent example. Its enormous decline in pending inventory materially altered the overall federal MDL picture even though that shift says little about the trajectory of newer mass torts such as Depo-Provera or GLP-1. The same problem appears at the individual-case level. A large absolute increase can look more significant than a smaller percentage increase simply because the underlying MDL is already enormous, while a very high percentage growth rate can exaggerate the practical significance of a proceeding that began with only a handful of cases.
Both scales are useful. Depo-Provera stands out under both measures because it added thousands of cases while increasing by more than tenfold. AFFF added more than 3,000 cases over twelve months, but its recent movement has been minimal. Talc added more than 2,000 cases over the same year, but against a base approaching 70,000, that represented only modest percentage growth. The comparison is more informative than any one of those numbers viewed in isolation.
The same data can also be useful to different audiences for different reasons. Lawyers may focus on where procedural pressure and resource demands are increasing. Funders may pay closer attention to how quickly a claimant population is building and how long capital may remain deployed. Insurers and corporate defendants may be more interested in whether a large exposure is still expanding or beginning to stabilize, while investors may care when those changes intersect with publicly disclosed litigation reserves or other company-specific liabilities. The JPML data do not answer all of those questions, but they provide a cleaner way to identify which proceedings deserve closer attention.
The current snapshot shows how the country’s largest mass torts are not necessarily its most dynamic ones, and the cases with the highest annual growth are not necessarily the ones still accelerating. Once those distinctions become visible, a harder question follows: whether they are merely descriptive or whether the path of an MDL can be predicted. If younger proceedings tend to pass through recurring stages of accumulation, plateau and contraction, then age, growth patterns and major procedural events may provide useful signals about what comes next.
That question requires a different analysis. The monthly numbers already show why it is worth asking: the federal mass-tort docket is measured regularly, but the more revealing question is what those measurements can tell us about where each proceeding is headed.