


The 2024-2025 Supreme Court Term and the Roberts Court History
Placing the StatPack in the context of the Roberts Court's history since 2005


The Supreme Court’s Subtle Realignments
The 2024–25 term of the U.S. Supreme Court unfolded against a national backdrop of political intensity and institutional skepticism. And yet, rather than exacerbating divisions, the Court revealed signs of complex internal dynamics amid high-stakes cases concerning digital speech, immigration authority, and birthright citizenship.
The SCOTUSblog Stat Pack that I developed along with Jake Truscott and released at the end of the term, offers clear quantitative signals of these subtle realignments. Unanimous decisions comprised 42% of the Court’s output—slightly below last term’s rate (44%) and down from the 50% peak in 2022–23, but still evidence that consensus remains a prominent mode of resolution in many cases and often those that stayed out of the headlines. Meanwhile, decisions split cleanly along ideological lines—6–3 outcomes with all Republican-appointed justices in the majority and all Democratic appointees in dissent—occurred in 9% of cases. That figure is down from the 13.74% average seen across the prior four terms, suggesting a slight tempering in the frequency of overtly partisan alignments or at least less ideologically salient cases.
At the individual level, Chief Justice John Roberts remains the most frequently aligned with the majority—voting with the Court’s final outcome in 95% of decided cases. That leadership role, both formal and strategic, continues to anchor the Court’s center-right core. On the other end of the spectrum, Justice Ketanji Brown Jackson was in the majority only 72% of the time—the lowest rate among the justices—reflecting her growing role as a distinct and increasingly vocal liberal dissenter.
This term also produced rulings with immediate policy impact, including a decisions related to nationwide injunctions, age verification on the internet, and the Affordable Care Act. Still, the deeper institutional story lies not just in the outcomes, but in how the Court is aligning, who is writing, and what trends are emerging.
This article builds on the Stat Pack by layering in historical perspective. The data visualizations below track voting behavior, majority authorship, coalition dynamics, and dissent patterns from 2005 through the present—culminating in a focused look at the last three years. What emerges is a clearer picture of how the Roberts Court is evolving: slowly, asymmetrically, but unmistakably in response to both external pressure and internal voice.
Majority Alignment and Voting Patterns
The abbreviation “VD” appears in various places. It refers to vote difference between the majority and minority coalitions so VD=1 is when there is one more majority than dissenting vote in a case which usually means it is a 5 to 4 split vote. VD=1-3 which appears throughout the article, refers to instances where there is a close split where there are at most twice as many votes in the majority as in the dissent. Voting statistics from prior terms were mainly located in the United States Supreme Court Database
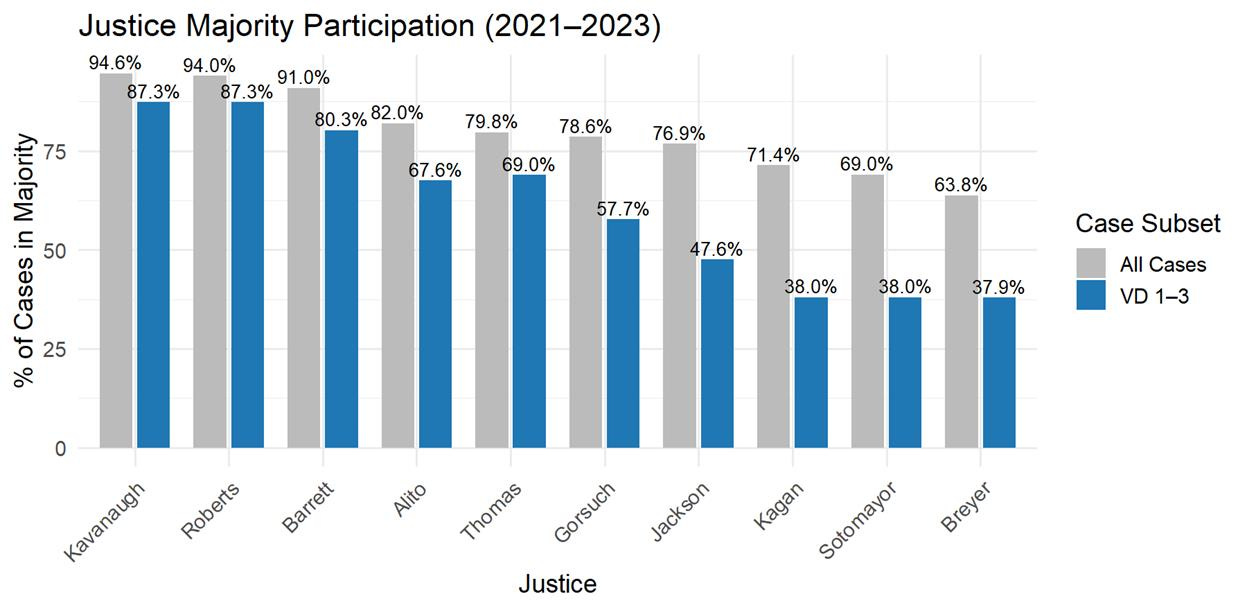
The first figure provides a focused snapshot of how frequently each justice joined the majority in the three terms prior to this past one (2021–2023), distinguishing between all cases (in gray) and VD 1–3 cases (in blue) —the subset reflecting the most legally or politically significant rulings.